Core features
Unified analytics dashboard
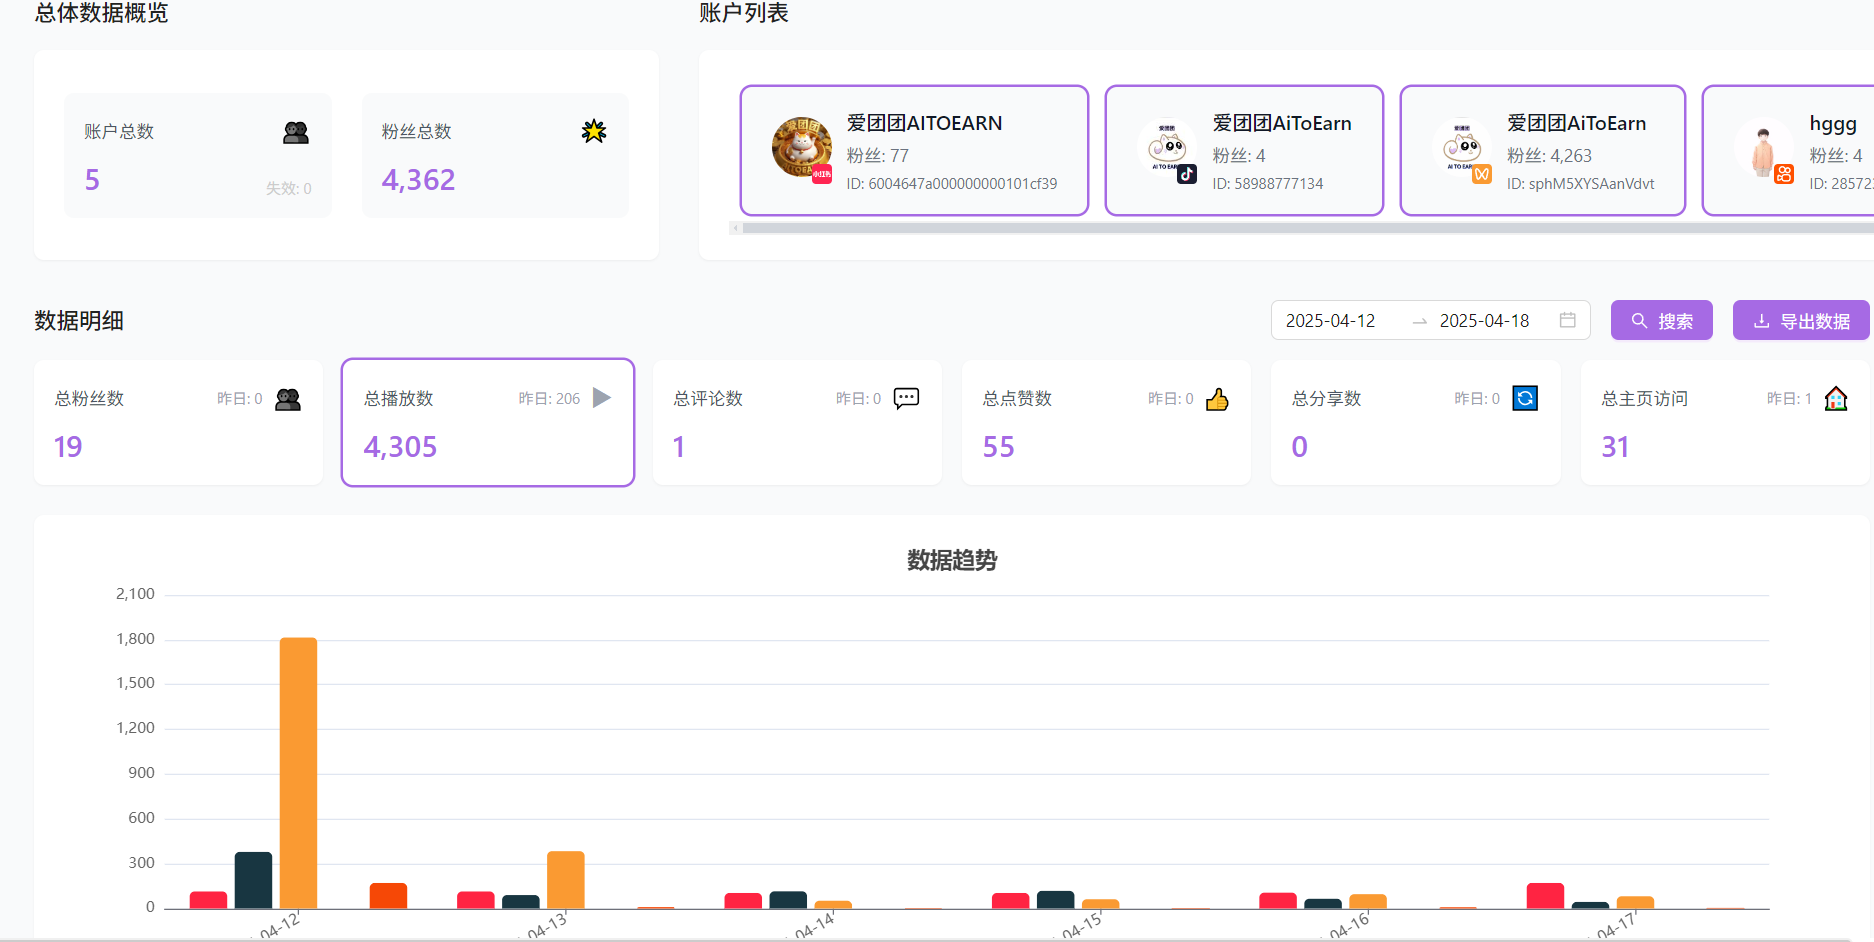
Our Home view consolidates all channels into one place. It’s the first screen you’ll see when you open the Analyze tab. Key highlights:- Real‑time updates
- Multi‑dimensional metrics
- Cross‑platform comparisons
- Visual charts
Cross‑platform content comparison
Compare how the same content performs across platforms to learn:- Platform differences (e.g., not great on TikTok but great on YouTube due to different audiences)
- Best publishing times
- Format optimization per platform
Quick start
- Open Analyze
- Log into Aitoearn
- Click the Data tab in the nav
- Choose your scope
- All platforms: aggregated performance across channels
- Single platform: deep‑dive into one network
- Pick a time range
- Day, week, month, quarter
- Compare trends over time
- Export reports
- Generate professional reports
- Export in multiple formats
Key metrics
Engagement
- Likes, comments, shares
- Engagement rate
- Reach
Audience
- Follower growth
- Geo distribution
- Active hours
- Audience profiles
Content performance
- Top‑performing posts
- Format effectiveness
- Hashtag analysis